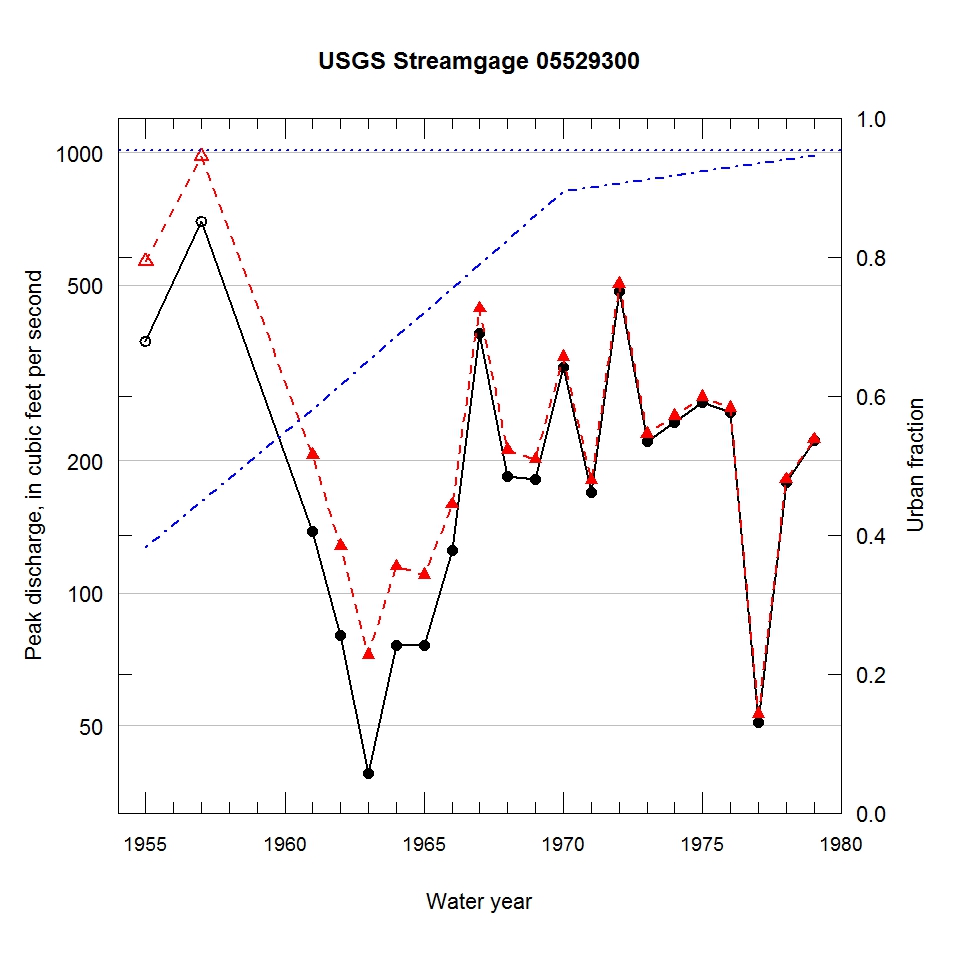
Observed and urbanization-adjusted annual maximum peak discharge and associated urban fraction and precipitation values at USGS streamgage:
05529300 MC DONALD CREEK NEAR WHEELING, IL


| Water year | Segment | Discharge code | Cumulative reservoir storage (acre-feet) | Urban fraction | Precipitation (inches) | Observed peak discharge (ft3/s) | Adjusted peak discharge (ft3/s) | Exceedance probability |
| 1955 | 1 | 7 | 0 | 0.382 | 3.446 | 372 | 565 | 0.012 |
| 1957 | 1 | 7 | 0 | 0.448 | 2.696 | 698 | 978 | 0.000 |
| 1961 | 1 | -- | 0 | 0.581 | 1.545 | 138 | 206 | 0.393 |
| 1962 | 1 | -- | 0 | 0.616 | 0.225 | 80 | 128 | 0.826 |
| 1963 | 1 | -- | 0 | 0.651 | 1.127 | 39 | 72 | 0.982 |
| 1964 | 1 | -- | 0 | 0.685 | 1.775 | 76 | 115 | 0.892 |
| 1965 | 1 | -- | 0 | 0.720 | 0.500 | 76 | 110 | 0.911 |
| 1966 | 1 | -- | 0 | 0.755 | 1.140 | 125 | 159 | 0.654 |
| 1967 | 1 | -- | 0 | 0.790 | 1.483 | 389 | 442 | 0.026 |
| 1968 | 1 | -- | 0 | 0.824 | 1.175 | 184 | 211 | 0.363 |
| 1969 | 1 | -- | 0 | 0.859 | 1.289 | 181 | 201 | 0.421 |
| 1970 | 1 | -- | 0 | 0.894 | 1.318 | 326 | 343 | 0.065 |
| 1971 | 1 | -- | 0 | 0.900 | 0.382 | 169 | 180 | 0.531 |
| 1972 | 1 | -- | 0 | 0.906 | 1.056 | 485 | 503 | 0.017 |
| 1973 | 1 | -- | 0 | 0.912 | 0.781 | 221 | 230 | 0.262 |
| 1974 | 1 | -- | 0 | 0.917 | 1.036 | 244 | 252 | 0.197 |
| 1975 | 1 | -- | 0 | 0.923 | 0.963 | 271 | 279 | 0.149 |
| 1976 | 1 | -- | 0 | 0.929 | 0.961 | 257 | 263 | 0.178 |
| 1977 | 1 | -- | 0 | 0.935 | 1.198 | 51 | 53 | 1.000 |
| 1978 | 1 | -- | 0 | 0.941 | 1.483 | 178 | 181 | 0.526 |
| 1979 | 1 | -- | 0 | 0.947 | 0.896 | 222 | 223 | 0.289 |

